We invite contributions that address:
• Advances in regional crop modeling frameworks (process-based, statistical, and hybrid)
• Integration of AI/ML techniques within a remote sensing and crop modeling framework
• Data assimilation techniques and model parameterization strategies
• Integration of remote sensing data into regional crop modeling systems
• Seasonal yield forecasting and the role of improved initial conditions via data assimilation
• Uncertainty quantification of regional crop model output
• Applications to water use, irrigation, and agro-hydrological monitoring
• Applications to assess and optimize climate change adaptation strategies
• Benchmarking and intercomparison of crop models with remote sensing data
This session brings together researchers in crop modeling, remote sensing, climate science, and data assimilation to advance integration across disciplines and tackle global challenges in agriculture and food security.
EGU26-16034 | ECS | Posters virtual | VPS5
Modelling the groundwater pumping for agriculture in the Noah-MP model to support sustainable water management over the North China PlainTue, 05 May, 15:06–15:09 (CEST) vPoster spot 2
EGU26-21818 | ECS | Posters virtual | VPS5
Deciphering Olive Yield Determinants under Contrasting Water Regimes: A Multi-Site Machine Learning Approach in Morocco Agro-EcosystemsTue, 05 May, 15:09–15:12 (CEST) vPoster spot 2
EGU26-231 | ECS | Posters virtual | VPS6
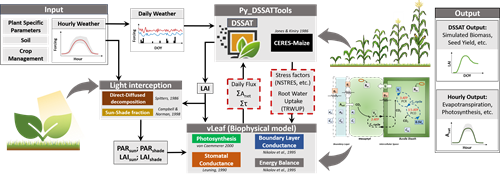
vLeaf@DSSAT: integrating leaf energy balance and biochemistry into CERES-Maize to reassess water-efficient ideotypesThu, 07 May, 14:45–14:48 (CEST) vPoster spot 2